InstaAccess
InstaAccess turns high-level security objectives into preventive, automated cloud controls—then continuously remediates findings without impacting workloads.
Core Capabilities
Proactive Hardening & Governance
Map objectives to frameworks (SOC 2, HIPAA, CIS)
Reduce attack surface (e.g., public access, encryption, admin restrictions)
Close architecture gaps with org-level policies
Automated Remediation of Findings
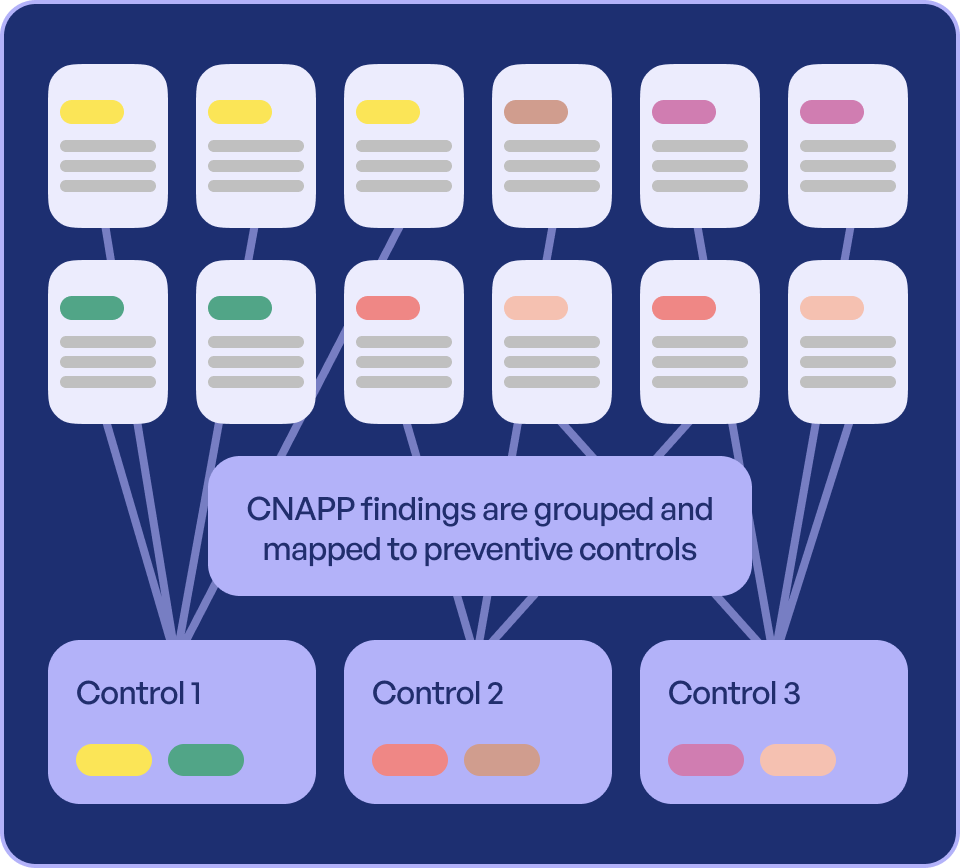
Ingest CNAPP/CIEM/DSPM alerts
Map each alert to its preventive control (e.g., right-size over-permissive IAM, quarantine public S3, restrict privileged actions)
Virtual Patching: enforce at the control plane—minutes, not days
How it Works
Preventive Cloud Controls for Complete Coverage
Proactive Hardening & Governance
InstaAccess helps security teams establish a strong, compliant, and resilient cloud posture—translating strategic goals into tangible, automated controls through a safe and verified process.
Automated Remediation of Findings
InstaAccess integrates seamlessly with your existing security stack to create a closed-loop remediation system, turning detection into immediate prevention.
Flexible Management
YOUR CLOUD, YOUR RULESEvery organization operates differently. InstaSecure supports your preferred workflow—whether you want a fully managed solution or prefer to integrate security into your development lifecycle.
Fully Managed by InstaSecure
Let our platform handle the full lifecycle of guardrail creation, deployment, and management based on your objectives—delivering the fastest path to a hardened security posture.
Co-Managed via CI/CD Integration
InstaSecure provides Infrastructure as Code and cloud-native configuration suggestions. Teams can take these verified policy recommendations and embed them directly into the CI/CD pipeline.
Key IAM Challenges We Solve
Gain Visibility and Control
Understand which service accounts, applications, and automated processes have access to your cloud environment.
Restrict access to only what is necessary, reducing the risk of privilege escalation and unauthorized use.
Address IAM Risks
Detect and remediate inactive or dormant permissions that could become attack vectors.
Minimize credential compromise, cross-account access, excessive permission, and unauthorized infrastructure modification risk.
Enforce Best Practices
Ensure every identity has a clear owner and follows strict encryption policies
Maintain alignment with industry standards and compliance mandates
How InstaAccess Makes it Easy
We help provide the tools and capabilities to simplifying your cloud identity management while enhancing security
Deep Identity Insights & Actionable Intelligence
Easy-to-read dashboards and reports that help you quickly understand access risks
Spot inactive or dormant permissions that should be revoked
Detect untrusted third -party network access, excessive permissions, privilege escalation risks, and toxic permission combinations.
Smart Prioritization & Risk-Based Filtering
Prebuilt and customizable filters help you focus on the highest-risk IAM issues.
Findings from external CNAPP are integrated to highlight the most risky permission combinations
Focus on the security issues that matter most to your organization
Comprehensive Policy Analysis
Assess net-effective permissions at multiple levels
- Service Control Policies (SCPs), Resource Control Policies (RCPs), and individual permission policies
- Permission boundaries, conditions, and tags
Identify complex permission interactions and inheritance patterns
Enterprise-Wide Cloud Controls
Create and enforce security policies across your organization
Implement Data Perimeters and Sensitive Permission Restrictions to define boundaries for access and limit critical resource access
Scale access controls consistently across teams and business units
Safe & Seamless Deployment of Controls
Apply new security policies with flexible opt-in/opt-out mechanisms
Works with Jira, Terraform, CI/CD Pipelines, Github and AWS for ease and automation of Cloud Controls rollout and management
Tag based deployment reduce time to enforcement significantly
Proactive Impact Assessment
Assess policy impact with organizational access mapping and net-effective permissions analysis.
Validate access events and usage with CloudTrail logs, Last Used Activity insights, and historical data.
Identify untrusted access risks like exposed credentials, third-party access, and toxic permission combos.
Exception Management
Handle and track exceptions for actively deployed IAM controls.
Enhance security while ensuring business continuity and operational efficiency.
Support business requirements with fine-tuned permissions that balance security and productivity.


